
Essential OHSE Equations are critical tools for professionals striving to maintain safe, healthy, and environmentally responsible workplaces.
At the beginning of any effective Occupational Health, Safety, and Environment (OHSE) program is the ability to measure risks, assess hazards, and track performance with reliable data.

This article explores ten fundamental OHSE equations, explaining how they work, why they matter, and how you can apply them to improve your safety program.
- Incident Rate (IR): Measuring Workplace Injuries
- Lost Time Injury Frequency Rate (LTIFR): Focusing on Severe Injuries
- Fatal Accident Rate (FAR): Tracking the Most Serious Outcomes
- Noise Exposure (Dose): Controlling Hearing Risks
- Heat Stress Index (WBGT): Protecting Workers in Hot Environments
- Airborne Contaminant Concentration: Ensuring Air Quality
- Ventilation Rate (Dilution Ventilation): Controlling Contaminants
- Risk Assessment (Risk Score): Qualitative Decision-Making
- Spill Volume Estimation: Quick Field Calculation
- Carbon Footprint (CO₂ Emissions): Managing Environmental Impact
- Why These Essential OHSE Equations Matter
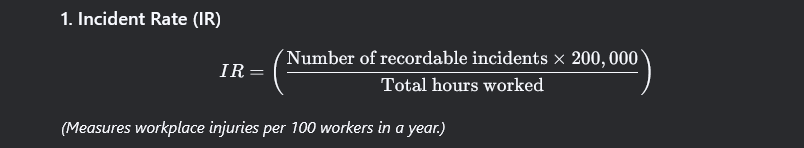
Incident Rate (IR): Measuring Workplace Injuries
Incident Rate (IR) = (Number of recordable incidents × 200,000) / Total hours worked
The Incident Rate (IR) is one of the most widely used OHSE metrics. It standardizes the number of recordable workplace injuries or illnesses to a baseline of 100 full-time employees working 40 hours per week over 50 weeks (200,000 hours).
This equation helps companies compare their safety performance with industry averages or internal goals. A high IR suggests the need for improved training, hazard controls, or safety culture. For benchmarking, organizations often use sources such as the U.S. Bureau of Labor Statistics (DoFollow link).
Example:
If you have 5 recordable injuries in 500,000 hours worked:
IR = (5 × 200,000) / 500,000 = 2.0
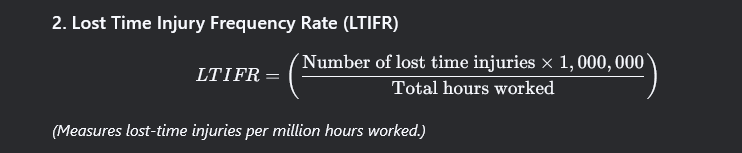
Lost Time Injury Frequency Rate (LTIFR): Focusing on Severe Injuries
LTIFR = (Number of lost time injuries × 1,000,000) / Total hours worked
The Lost Time Injury Frequency Rate (LTIFR) tracks injuries resulting in time away from work, per million hours worked. This focus on severity helps prioritize controls for high-risk activities.
Organizations use LTIFR to communicate safety performance to stakeholders, set goals, and benchmark against industry norms. For guidance on improving your LTIFR, visit Safe Work Australia (DoFollow link).
Example:
4 lost time injuries in 800,000 hours worked:
LTIFR = (4 × 1,000,000) / 800,000 = 5.0
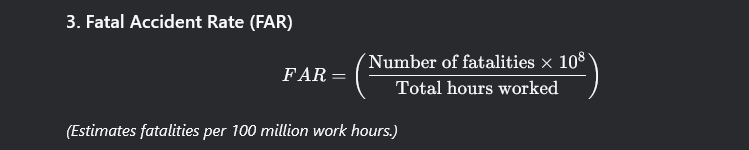
Fatal Accident Rate (FAR): Tracking the Most Serious Outcomes
FAR = (Number of fatalities × 10⁸) / Total hours worked
Fatal Accident Rate (FAR) expresses workplace fatalities per 100 million work hours. It is a critical metric for industries with high fatality risk, such as mining, construction, or transportation.
Example:
1 fatality in 20 million hours worked:
FAR = (1 × 100,000,000) / 20,000,000 = 5.0
This metric drives investment in high-level controls and culture change to achieve a Zero Harm objective.
Noise Exposure (Dose): Controlling Hearing Risks
Noise Dose (%) = (C1/T1 + C2/T2 + … + Cn/Tn) × 100
Where:
- C = actual exposure time at a given noise level
- T = permissible exposure time at that level
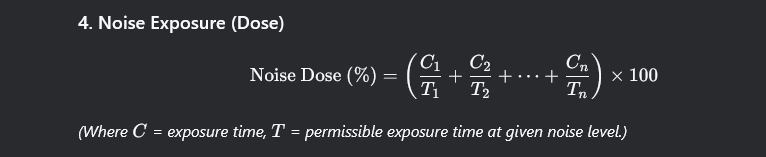
Noise dose calculations help determine compliance with standards like NIOSH and OSHA. A dose over 100% indicates overexposure and requires engineering or administrative controls, PPE, or other mitigations.
Example:
- 2 hours at 95 dBA (T = 4 hours)
- 1 hour at 100 dBA (T = 2 hours)
Noise Dose = ((2/4) + (1/2)) × 100 = (0.5 + 0.5) × 100 = 100%
Heat Stress Index (WBGT): Protecting Workers in Hot Environments
WBGT = 0.7Tw + 0.2Tg + 0.1Ta
- Tw = wet bulb temperature
- Tg = globe temperature
- Ta = air temperature
The Wet Bulb Globe Temperature (WBGT) estimates heat stress risk by integrating humidity, radiant heat, and air temperature. It’s crucial for planning work/rest cycles, hydration, and PPE in hot environments.

Example:
- Tw = 28°C, Tg = 30°C, Ta = 32°C
WBGT = 0.7×28 + 0.2×30 + 0.1×32 = 19.6 + 6 + 3.2 = 28.8°C
Resources like OSHA’s Heat Illness Prevention provide guidelines for using WBGT.
Airborne Contaminant Concentration: Ensuring Air Quality
C = m / V
- C = concentration (mg/m³)
- m = mass of contaminant collected (mg)
- V = volume of air sampled (m³)
Industrial hygienists use this formula to evaluate exposure to dusts, fumes, gases, or vapors. Results inform engineering controls, ventilation, and PPE selection.

Example:
10 mg contaminant in 2 m³ air:
C = 10 / 2 = 5 mg/m³
Learn more from ACGIH.
Ventilation Rate (Dilution Ventilation): Controlling Contaminants
Q = G / (Ctarget – Cbackground)
- Q = airflow rate (m³/min)
- G = contaminant generation rate (mg/min)
- Ctarget = acceptable concentration (mg/m³)
- Cbackground = existing background concentration
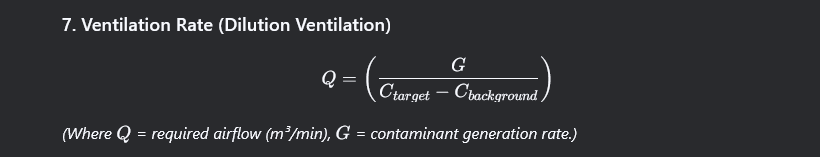
This equation helps design dilution ventilation systems to maintain safe contaminant levels. It’s essential for controlling gases, vapors, or fumes in manufacturing or labs.
Example:
- G = 100 mg/min
- Ctarget = 2 mg/m³
- Cbackground = 0.5 mg/m³
Q = 100 / (2 – 0.5) = 66.7 m³/min
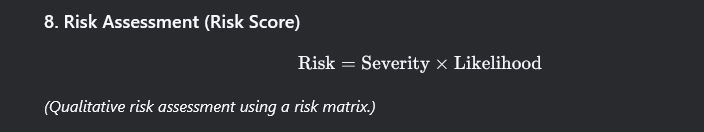
Risk Assessment (Risk Score): Qualitative Decision-Making
Risk = Severity × Likelihood
Risk matrices transform subjective judgments into structured, repeatable assessments. Severity measures potential impact, while likelihood assesses the probability of occurrence.
Example:
- Severity = 4 (Major injury)
- Likelihood = 3 (Possible)
Risk Score = 12
This guides prioritization of controls and compliance with standards like ISO 45001.
Spill Volume Estimation: Quick Field Calculation
V = A × d
- V = volume (m³ or liters)
- A = area of spill (m²)
- d = average depth (m)
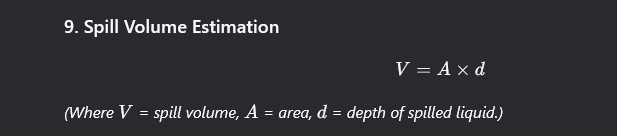
Used in emergency response, this calculation helps determine the scale of cleanup, containment needs, and reporting requirements.
Example:
- Area = 5 m²
- Depth = 0.02 m
V = 5 × 0.02 = 0.1 m³ = 100 liters
Refer to EPA Spill Response Guidelines.
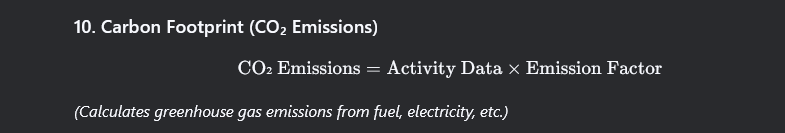
Carbon Footprint (CO₂ Emissions): Managing Environmental Impact
CO₂ Emissions = Activity Data × Emission Factor
This widely used equation estimates greenhouse gas emissions from fuel use, electricity, transport, and other activities. Essential for sustainability reporting and meeting regulations such as the GHG Protocol.
Example:
- 1000 liters diesel
- Emission Factor = 2.68 kg CO₂/liter
CO₂ = 1000 × 2.68 = 2680 kg CO₂
Why These Essential OHSE Equations Matter
Essential OHSE Equations turn raw data into meaningful safety and environmental insights. They enable:
- Benchmarking against industry standards
- Regulatory compliance
- Proactive risk management
- Better training and communication
- Continuous improvement
By mastering these formulas, safety professionals can build safer workplaces, reduce environmental impact, and foster a culture of care and responsibility.
For more resources and best practices, visit OHSE.ca (DoFollow link).
Conclusion
Essential OHSE Equations are not just academic—they’re practical, essential tools for every safety professional.
Whether calculating incident rates, assessing ventilation needs, or estimating your carbon footprint, these equations support smarter decisions and safer outcomes. Use them to strengthen your safety program, reduce risk, and champion environmental stewardship.
Essential OHSE Equations remain at the heart of effective Occupational Health, Safety, and Environment management.
No comments yet