 Skip to content

Safety Related Equations Tools
Risk Assessment
This tool calculates the risk score by multiplying the likelihood of an event with its severity. A higher score indicates a higher priority hazard that needs control measures.
Incident Frequency Rate (FR)
The frequency rate measures how often injuries occur, standardized per million work hours. It helps compare safety performance across organizations.
Incident Severity Rate (SR)
The severity rate shows how serious injuries are by calculating lost workdays per million hours worked. A high value means accidents have severe consequences.
Time Weighted Average (TWA)
The TWA calculates average chemical exposure over an 8-hour shift. It considers varying exposure levels during the day and compares them to exposure limits.
Noise Dose (OSHA)
This formula calculates noise exposure as a percentage of the legal limit. If the result is over 100%, workers are overexposed and need hearing protection or shorter exposure times.
Wet Bulb Globe Temperature (WBGT)
WBGT is a heat stress index combining humidity, radiant heat, and air temperature. It helps determine safe work/rest schedules to prevent heat illness.
Safety Factor (SF)
The safety factor ensures structures or machines can handle more than the expected load. A higher SF means extra protection against unexpected stress or failure.
Accident Frequency Ratio (AFR)
AFR is another method to measure accident frequency per million hours worked, used in some industries for benchmarking safety.
Risk Priority Number (RPN – FMEA)
RPN comes from Failure Mode and Effects Analysis. It multiplies severity, occurrence, and detection ratings to prioritize risks that need the most urgent controls.
Safety Related Equations are more than just formulas—they are practical tools that help safety professionals measure, predict, and prevent accidents.

From calculating workplace risks to assessing chemical exposures, these equations turn abstract hazards into measurable values. By using them effectively, organizations can strengthen their occupational health and safety (OHSE) programs and make data-driven decisions.
Why Safety Related Equations Matter
Workplace safety isn’t just about intuition—it’s about evidence. Safety related equations provide measurable ways to assess hazards, benchmark performance, and justify preventive actions.
For example, instead of simply guessing if noise exposure is too high, professionals can calculate the Noise Dose to prove whether workers are overexposed.
This scientific approach not only improves compliance with standards like OSHA and ISO 45001 but also protects workers from preventable injuries.
Key Safety Related Equations and Tools
Below are the most widely used safety related equations, each with a simple explanation of how they work in practice:
1. Risk Assessment Formula
Equation:
Risk = Likelihood × Severity
This simple equation helps rank hazards. If a task has a high probability of happening and severe consequences, it must be prioritized. Many organizations use this as the foundation for their risk matrix.
2. Incident Frequency Rate (FR)
Equation:
FR = (Number of Injuries × 1,000,000) ÷ (Total Work Hours)
The FR allows companies to compare their injury rates with industry benchmarks. For example, construction firms often use this to show clients their safety performance record.
3. Incident Severity Rate (SR)
Equation:
SR = (Lost Workdays × 1,000,000) ÷ (Total Work Hours)
While FR measures how often accidents happen, SR measures how serious they are. A high SR suggests that workplace incidents result in significant time off work.
4. Time Weighted Average (TWA) for Exposure
Equation:
TWA = (C1T1 + C2T2 + ... + CnTn) ÷ 8
This equation calculates the average exposure to a chemical over an 8-hour shift. Occupational hygienists use TWA to check compliance against permissible exposure limits (PELs).
5. Noise Dose (OSHA)
Equation:
D = Σ (C ÷ T) × 100
Where C is the time exposed at a noise level, and T is the allowable time. If D exceeds 100%, workers are exposed to unsafe noise levels and need controls such as hearing protection.
6. Wet Bulb Globe Temperature (WBGT)
Equation:
WBGT = 0.7Tnwb + 0.2Tg + 0.1Tdb
Heat stress is a critical hazard in outdoor and industrial environments. WBGT provides a reliable way to determine safe work-rest cycles and prevent heat-related illnesses.
7. Safety Factor (Engineering)
Equation:
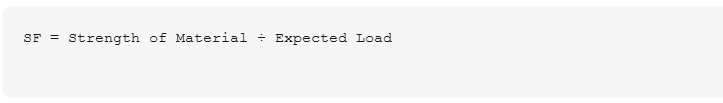
Engineers use the safety factor to ensure machines, tools, and structures can withstand more than the expected load, providing a margin of protection.
8. Accident Frequency Ratio (AFR)
Equation:
AFR = (Number of Accidents × 1,000,000) ÷ (Total Man-Hours Worked)
Similar to FR, this is another benchmarking tool widely used in heavy industries like oil and gas.
9. Risk Priority Number (RPN – FMEA)
Equation:
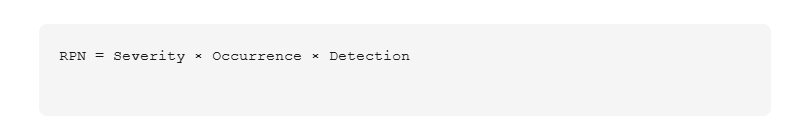
This is used in Failure Mode and Effects Analysis (FMEA). The higher the RPN, the more urgent the corrective action needed to eliminate or reduce the hazard.
From Equations to Tools
Manually calculating each of these can be time-consuming, especially for OHSE managers dealing with multiple hazards daily. That’s why we built an online page with interactive calculators for each safety-related equation.
This page includes working calculators for:
- Risk Assessment
- Incident Frequency Rate
- Incident Severity Rate
- Time Weighted Average (TWA)
- Noise Dose (OSHA)
- Wet Bulb Globe Temperature (WBGT)
- Safety Factor
- Accident Frequency Ratio (AFR)
- Risk Priority Number (RPN)
With simple input fields and instant results, safety professionals can quickly analyze risks and make informed decisions.
Final Thoughts
Safety Related Equations transform safety from guesswork into science. Whether you’re calculating exposure limits, benchmarking safety performance, or prioritizing hazards, these formulas help you back decisions with data.
By combining them with practical tools, workplaces can not only achieve compliance but also create safer, healthier environments for their employees.
Next time you assess a workplace risk, remember—behind every safety decision, there’s likely an equation guiding it.
No comments yet