
Leading Indicators in Safety That Predict Better Outcomes


Leading indicators in safety help organizations spot risk before an injury, spill, equipment failure, or regulatory violation occurs.
Instead of waiting for bad outcomes to reveal weak controls, safety leaders can use early warning signals to improve training, supervision, maintenance, and worker engagement.
That matters in every industry, from construction and manufacturing to warehousing, healthcare, and field services.
When tracked consistently, leading indicators in safety show whether critical prevention activities are actually happening on the ground.
They also create a more proactive safety culture by shifting attention from blame after an incident to action before one happens.

- Why leading indicators in safety matter more than counting injuries alone
- Essential leading indicators in safety every workplace should track
- Leading indicators in safety vs lagging indicators: key differences with examples
- How to choose leading indicators in safety that actually improve outcomes
- Turning leading indicators in safety into a stronger safety culture
Why leading indicators in safety matter more than counting injuries alone
Many companies still rely heavily on lagging indicators such as total recordable injury rates, lost-time injuries, workers’ compensation costs, vehicle crashes, and property damage.
These measures are useful, but they only tell you what has already gone wrong.
By contrast, leading indicators in safety track the conditions, behaviors, and system activities that influence future performance.
Examples include completion of safety observations, closure of corrective actions, supervisor field presence, preventive maintenance compliance, and employee participation in hazard reporting.
Think of lagging indicators as the score at the end of the game, while leading indicators are the plays that shape the result.
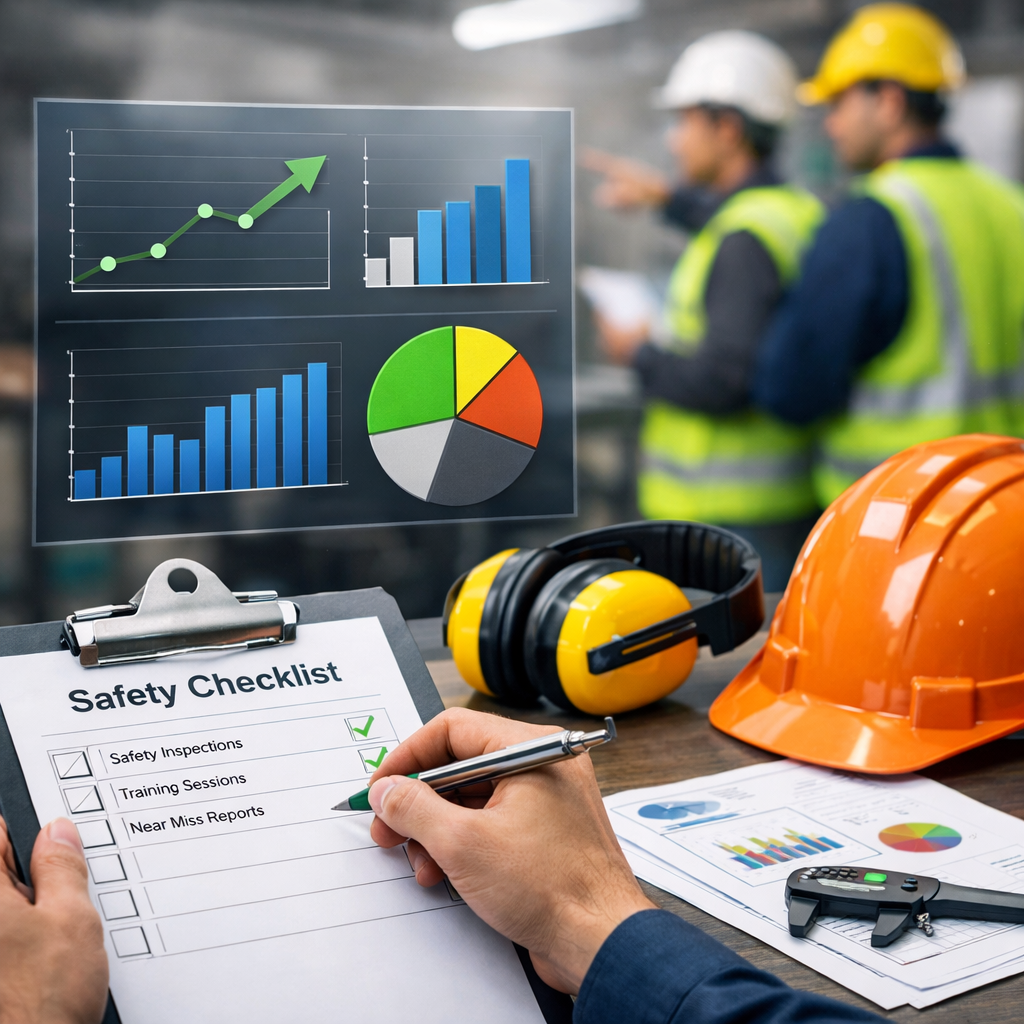
If a site reports two serious hand injuries last quarter, that is a lagging indicator.
If the same site also shows poor machine guarding inspections, low lockout/tagout training completion, and overdue maintenance work orders, those are leading indicators pointing to a preventable problem.
Organizations such as OSHA and CCOHS support proactive safety management because strong systems usually perform better than reactive ones.
A mature safety program uses both types of measures together.
Lagging indicators confirm outcomes, while leading indicators in safety help predict and improve them.
Essential leading indicators in safety every workplace should track
Not every metric is meaningful.
The best leading indicators in safety are specific, measurable, relevant to the work, and connected to real risk controls.
They should reflect what prevents serious injuries and fatalities, not just what is easy to count.
Hazard identification and reporting
A healthy number of reported hazards is often a positive sign, not a negative one.
It shows workers are engaged, trust the reporting process, and believe issues will be fixed.

Track the number of hazards reported, response times, and closure rates.
Also measure the quality of reports, since vague submissions are less useful than reports that identify location, task, exposure, and immediate controls.
Corrective action completion
Finding hazards means little if they remain unresolved.
One of the strongest leading indicators in safety is the percentage of corrective actions closed on time, especially those linked to high-risk findings.
Sites should also monitor overdue items by severity and verify whether controls are effective after implementation.
Training and competency verification
Training completion rates matter, but competency matters more.
A safer measure includes not only attendance, but also demonstrations of skill, supervisor sign-off, refresher frequency, and job-specific qualification.
For example, forklift operators, confined space attendants, and maintenance staff working under lockout procedures should all have verified competency records.
Inspections, observations, and preventive maintenance
Routine inspections reveal whether standards are followed consistently.
Behavior-based observations, supervisor walkarounds, and equipment inspections can identify drift before it becomes dangerous.
Preventive maintenance completion is especially important where machinery, vehicles, pressure systems, or electrical equipment are involved.
- Safety observations completed: Are supervisors and peers identifying safe and unsafe conditions in real work areas?
- Near-miss reporting rate: Are people sharing events that could have caused harm?
- Preventive maintenance compliance: Are critical assets serviced before failure occurs?
- Pre-job risk assessments: Are teams reviewing hazards before starting non-routine or high-risk work?
- Safety meeting participation: Are workers actively contributing, not just attending?
- PPE compliance checks: Is personal protective equipment used correctly where required?
For more practical guidance, many organizations also build these metrics into their own safety management system and incident reporting process so action is easier to track over time.
Leading indicators in safety vs lagging indicators: key differences with examples
Understanding the distinction helps leaders choose balanced metrics.
Lagging indicators measure events that have already happened.
Leading indicators measure the activities and conditions that influence whether those events happen in the first place.
| Type | What it measures | Examples | How it helps |
|---|---|---|---|
| Leading indicators | Preventive actions, control quality, and system performance | Hazard reports, training verification, maintenance completion, pre-task assessments | Predicts risk and supports early intervention |
| Lagging indicators | Incidents and losses that already occurred | Recordable injuries, lost-time cases, claims costs, damage events | Shows historical outcomes and trends |
Consider a warehouse with frequent pedestrian and forklift interaction.
A lagging indicator would be the number of struck-by incidents or near injuries recorded during the quarter.
Leading indicators in safety would include daily pre-use forklift checks, traffic route inspections, supervisor observations of speed compliance, and the number of blocked walkways corrected within 24 hours.
In construction, a lagging indicator could be a fall injury.
Leading indicators could include guardrail inspection completion, working-at-heights training verification, anchor point checks, and toolbox talks focused on changing site conditions.
In healthcare, a lagging indicator might be a sharps injury.
Leading indicators might include audits of sharps disposal container placement, orientation for new staff, and restocking rates for safety-engineered devices.
The point is simple: lagging indicators tell you where you have been, while leading indicators in safety help determine where you are heading.
How to choose leading indicators in safety that actually improve outcomes
The most effective metrics are tied to critical risks, not generic activity counts.
If a company faces exposures related to energy isolation, mobile equipment, chemical handling, or falls, its leading indicators should directly measure the strength of those controls.
That is where the Hierarchy of Controls becomes useful.
Instead of focusing only on PPE checks, organizations should also track stronger controls such as elimination, substitution, engineering controls, and administrative controls.
For example, if workers are exposed to excessive noise, stronger leading indicators may include completion of noise mapping, installation of quieter equipment, enclosure maintenance, and fit-testing for hearing protection where residual risk remains.
If chemical exposure is a concern, useful leading indicators may include ventilation inspection records, substitution reviews for less hazardous products, SDS availability, and emergency eyewash testing.
What good metrics look like
Good leading indicators in safety have a clear link to risk reduction.
They are easy to understand, reviewed regularly, and assigned to accountable leaders.
Most importantly, they drive action rather than paperwork.
- They focus on high-risk work, not just low-risk tasks.
- They measure timeliness, quality, and follow-through.
- They can be verified in the field.
- They encourage worker participation and trust.
- They are reviewed alongside lagging indicators for context.
A common mistake is rewarding only low injury rates.
That can discourage reporting and hide weak controls.
A better approach is to recognize teams for reporting hazards, closing actions quickly, participating in inspections, and improving safeguards.
When managers discuss these measures during operations reviews, safety becomes part of how work is managed, not a separate compliance exercise.
It also helps to benchmark internally across departments and shifts.
If one area completes risk assessments consistently and another does not, that gap may explain later differences in incident outcomes.
Turning leading indicators in safety into a stronger safety culture
Metrics alone do not prevent harm.
They work only when leaders respond visibly, remove barriers, and invest in controls that make work safer.
That means closing the loop with employees, verifying that corrective actions stay effective, and using trend data to improve planning.
If near-miss reports rise after a reporting campaign, that may indicate growing trust.
If the same hazards appear month after month, the issue is not reporting volume but weak problem solving.
Review leading indicators in safety at the same frequency as production, quality, and cost metrics.
Ask whether supervisors are present in the field, whether high-risk permits are audited, whether contractors meet site requirements, and whether serious hazards are escalated fast enough.
Then connect those findings to practical improvements such as guard upgrades, traffic management changes, revised procedures, or better staffing during peak demand.
Over time, this creates a cycle of anticipation, action, and learning.
That is why leading indicators in safety are so valuable: they reveal whether your organization is building the habits and controls that predict better outcomes long before the injury statistics appear.
No comments yet