
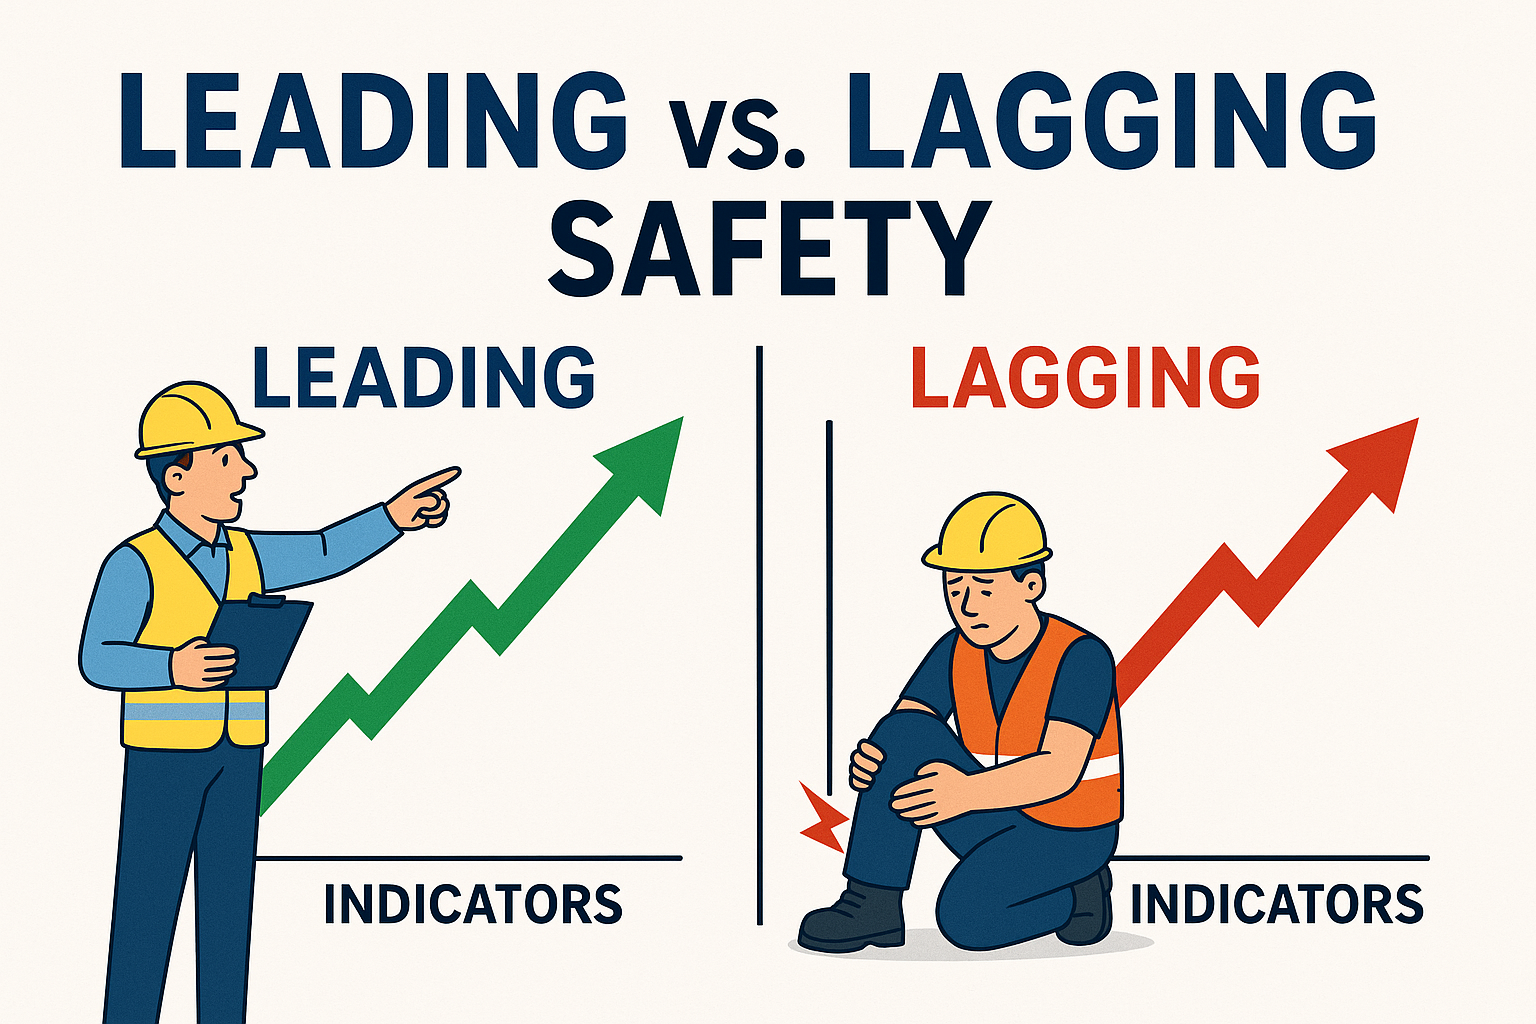
Leading vs. Lagging Safety Indicators is one of the most critical distinctions in workplace safety management. Understanding these two types of metrics helps organizations shift from reactive to proactive safety strategies.
- Leading vs. Lagging Safety Indicators
- What Are Safety Indicators?
- ✅ What Are Lagging Indicators?
- ✅ What Are Leading Indicators?
- 📊 Leading vs. Lagging Indicators: Comparison Table
- 🚀 Why You Need Both Leading and Lagging Indicators
- 📈 How to Track and Use Safety Indicators
- 🧠 Practical Example: Construction Site
- 🔁 Internal Link Suggestions
- 🏁 Conclusion: Build a Balanced Safety Strategy
Leading vs. Lagging Safety Indicators

While lagging indicators tell you what has already gone wrong, leading indicators provide insight into what could go wrong—offering a chance to intervene before an incident occurs. Using both is key to developing a mature, data-driven safety culture.
What Are Safety Indicators?
Safety indicators are measurable elements used to track safety performance. They inform decisions, measure effectiveness, and shape safety goals.
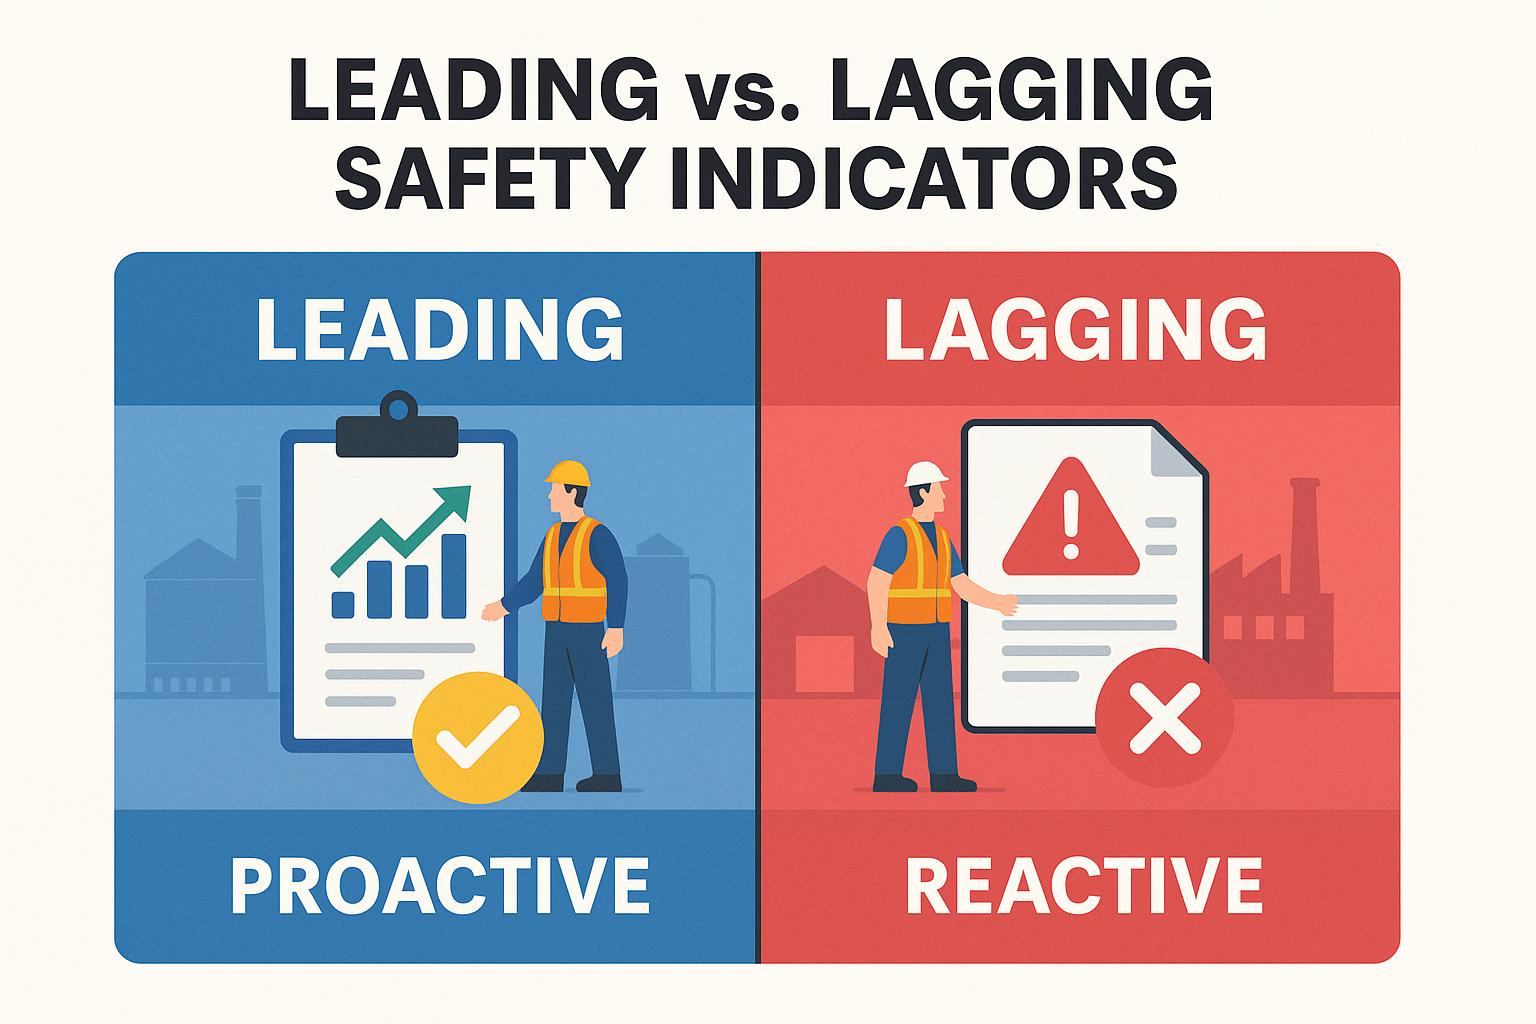
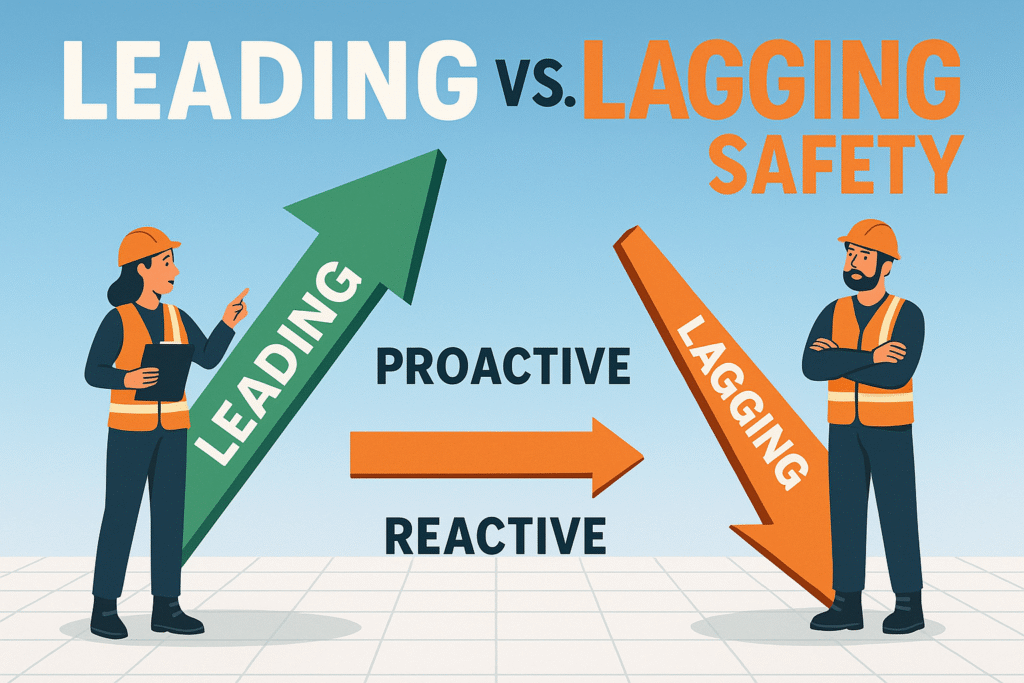
- Leading indicators are proactive, predictive, and focus on prevention.
- Lagging indicators are reactive, outcome-based, and reflect past safety performance.
Together, they help build a more complete safety picture.
✅ What Are Lagging Indicators?
Lagging safety indicators are retrospective—they measure the outcome of safety failures. These are the most commonly tracked metrics because they’re tangible and easy to measure.
Examples of Lagging Indicators:
- Total Recordable Incident Rate (TRIR)
- Lost Time Injury Frequency Rate (LTIFR)
- Number of days without an injury
- Workers’ compensation claims
- Severity of incidents
- OSHA citations or fines
Pros:
- Clear and objective
- Easy to report and benchmark
- Recognized by regulators and insurers
Cons:
- Can’t prevent incidents—only report them
- Focus on outcomes, not causes
- May hide unsafe practices if no incident occurred
✅ What Are Leading Indicators?
Leading safety indicators are predictive—they track behaviors, conditions, and activities that contribute to safety performance before an incident happens.
Examples of Leading Indicators:
- Number of safety training sessions completed
- Safety observations and audits performed
- Near-miss reports submitted
- Preventive maintenance completed
- Employee participation in safety meetings
- Hazard identifications resolved
Pros:
- Encourage proactive safety culture
- Allow intervention before incidents
- Drive continuous improvement
Cons:
- Can be harder to measure consistently
- May require culture change to adopt
- Risk of “checking boxes” without meaningful engagement
📊 Leading vs. Lagging Indicators: Comparison Table
| Aspect | Leading Indicators | Lagging Indicators |
|---|---|---|
| Timing | Predictive / Proactive | Retrospective / Reactive |
| Focus | Behavior, conditions, actions | Incidents, injuries, losses |
| Objective | Prevent incidents | Measure outcomes |
| Examples | Near misses, training completed | Lost time injuries, fatalities |
| Control | High (can be influenced) | Low (only reported after the fact) |
| Value to Safety Culture | Builds engagement and accountability | Monitors compliance and performance |
🚀 Why You Need Both Leading and Lagging Indicators
A robust safety program doesn’t rely on just one type of indicator. Leading indicators help identify weaknesses and improve processes. Lagging indicators provide historical performance and verify whether changes are effective.
Together, they create a feedback loop:
- Leading indicators guide preventive actions.
- Lagging indicators validate success or expose gaps.
- The data informs future leading indicator strategies.
📈 How to Track and Use Safety Indicators
1. Establish Clear Definitions
Clearly define each metric and how it will be measured. For example, a “near miss” should have a consistent definition across all departments.
2. Set Measurable Goals
Example: “Conduct 10 behavior-based safety observations per week per site.”
3. Use Technology to Streamline Tracking
Use safety software tools like:
- EcoOnline
- SafetyCulture iAuditor
- Salus Pro
- OHSE.ca Templates – DoFollow
4. Review Trends Regularly
Don’t just collect data—analyze it. Look for patterns such as:
- Decreasing hazard reports → cultural disengagement
- Increasing training hours → improved awareness
5. Share Results Transparently
Communicate both positive trends and areas for improvement during toolbox talks and safety committee meetings.
🧠 Practical Example: Construction Site
| Scenario | Leading Indicator | Lagging Indicator |
|---|---|---|
| Workers exposed to fall risks | % of employees completing fall protection training | Number of fall-related injuries |
| Housekeeping issues in work zones | Number of weekly inspections | Slips, trips, and falls reported |
| PPE non-compliance observed | Corrective actions issued per audit | Eye injuries reported |
🔁 Internal Link Suggestions
- How to Conduct a Job Hazard Analysis (JHA)
- Top 10 Daily Habits That Make Workplaces Safer
- Behavior-Based Safety (BBS)
🏁 Conclusion: Build a Balanced Safety Strategy
Understanding Leading vs. Lagging Safety Indicators gives you a more complete view of your organization’s safety health. While lagging indicators show what happened, leading indicators help prevent it from happening again.
Smart safety programs use both to drive continuous improvement, prevent injuries, and engage teams.
Don’t just measure what went wrong—start predicting what can go right.
No comments yet